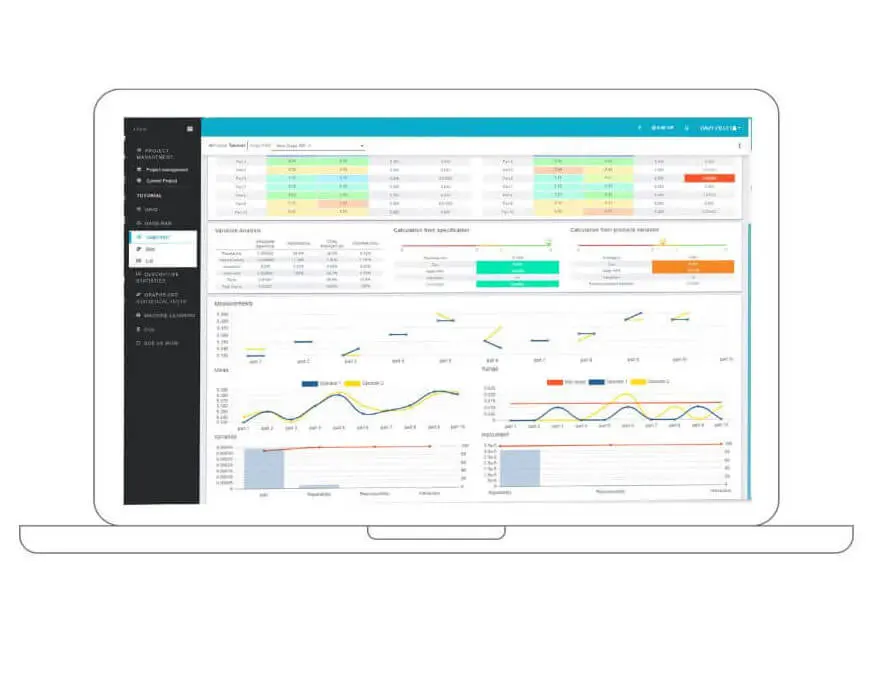
Visit your data
Easily format your data using intuitive software
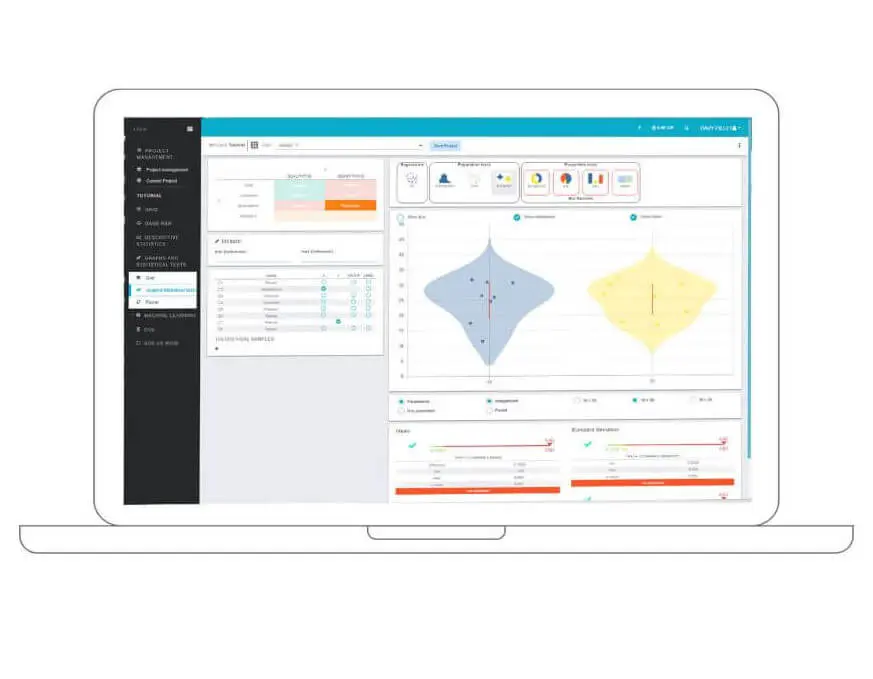
Take control of your graphics
You no longer need to know which chart is the right one, but which data to analyse. Ellistat will suggest the appropriate graphs, and all you have to do is let us guide you.

Test under real conditions
Graphical analysis software
All our graphics can be customised so that you can share the right information with your staff.

Features
Clouds of Points :
- Visualising Correlations Tools for creating scatter plots to examine relationships and correlations between two continuous variables.
Diagonal Matrix Graphics :
- Multivariate analysis Generation of diagonal matrix graphs to visualise relationships between several pairs of variables simultaneously.
Boxplots :
- Visual Statistical Summary : Use of whisker boxes to display the distribution of the data, including the median, quartiles and outliers.
Dot Plots :
- Frequency representation Creating dot diagrams to represent data distribution simply and effectively.
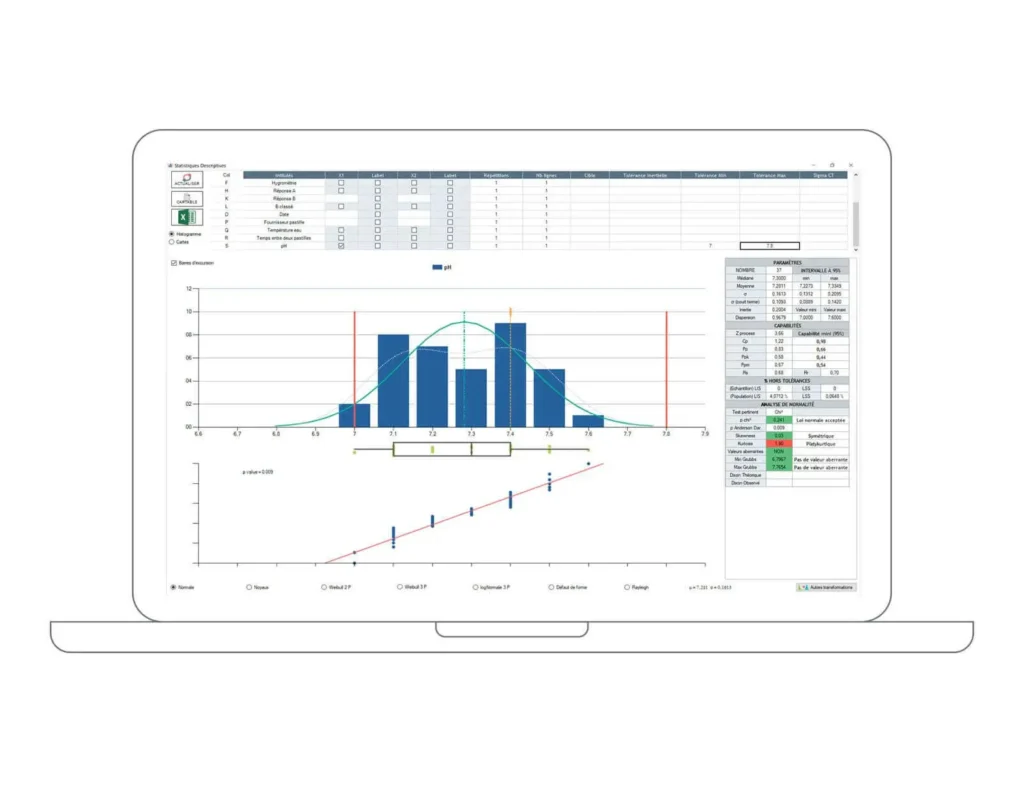
Histograms :
- Data distribution Construction of histograms to illustrate the frequency of values in a data set and identify trends and deviations.
Time Series Charts :
- Time Analysis Tools for creating time series diagrams, enabling you to track variations in data over time.
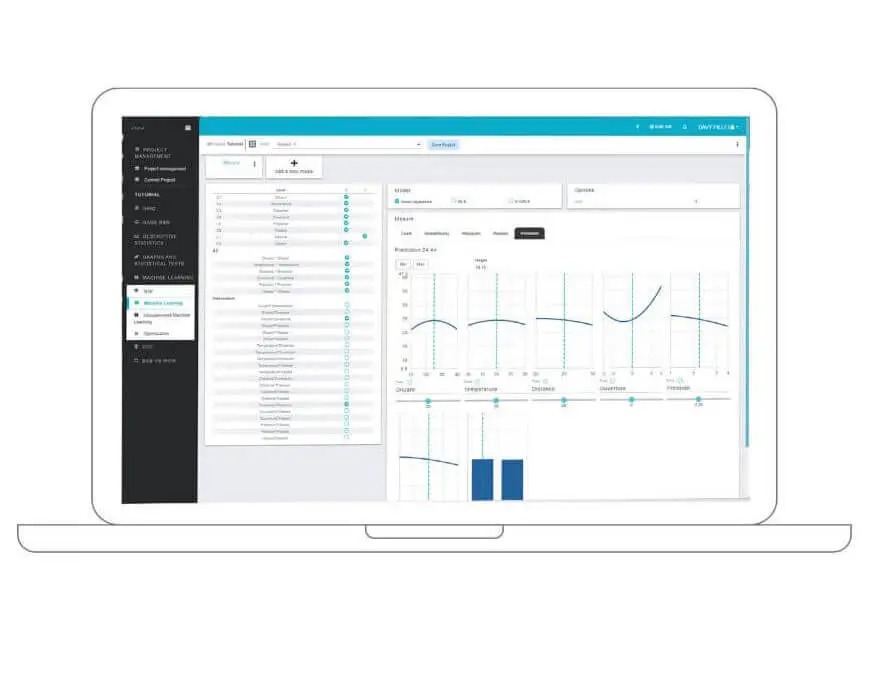
Linear regression :
- Linear Relationship Modelling Linear regression functionality, used to model and predict the relationship between a dependent variable and one or more independent variables.
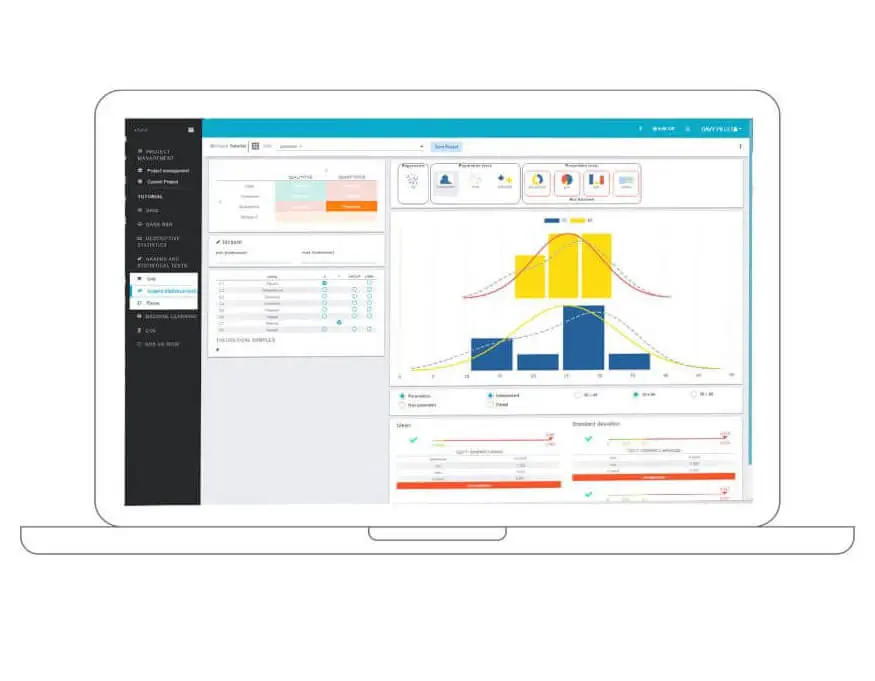
Statistical evidence :
- Model Validation Tools to provide statistical evidence such as p-values, confidence intervals and hypothesis testing to validate models and analyses.
A complete solution for Industry 4.0
6 integrated statistical modules
Your feedback
Ellistat, an intuitive statistical tool

As part of the continuous improvement of our product offering in both the development and production phases, I wanted to develop a number of quality tools within the WIRQUIN group. To achieve this, and given the challenges involved, it quickly became apparent that a data processing software package was essential to improve efficiency. I quickly chose the Ellistat software because of its many on-board functions and its ease of access, even if the algorithms behind it are much less easy! What's more, the fact that it's a floating licence rather than an individual licence means a rapid return on investment. Don't ask me how we would do without Ellistat from now on, I wouldn't know how to answer!

Complete, powerful, efficient and impressively simple! A must-have for anyone who needs to talk about their data.

The right price to your needs

Demonstration
0€
Data Analysis Module
- 30 days
- All Ellistat functions
- 1 user
Technical support and updates included

Student / Teacher
0€
Data Analysis Module
- 1 year
- All Ellistat functions
- 1 user
- Licence dedicated to students with a student card currently valid
Technical support and updates included

Standard
79/user/month
Data Analysis Module
- Licence renewed every month
- All Ellistat functions
- Unlimited users
- Technical support and updates included

